Reactivation Model
In August 2023, I developed a reactivation model for Axis Securities to predict dormant customers for reactivation. I designed and implemented the prediction model from scratch using Python 3, along with libraries like Matplotlib 3.8.2, Pandas 2.1.3, Sklearn Metrics, and tools such as Jupyter Notebook, PostgreSQL, and Excel. This involved comprehensive processes including feature engineering, hyperparameter tuning, and deployment. As a result, the model significantly enhanced performance and provided actionable insights, achieving an impressive 68.2% recall rate, surpassing the previous model by 12%.
Gold Price Prediction Model Using Random Forest Algorithm
Utilising the Random Forest Algorithm and the Kaggle dataset, I developed a Gold Price prediction model that demonstrated remarkable accuracy, achieving a 98.92% success rate. The model was trained on diverse datasets, including US oil prices, S&P 500 data, Silver prices, and the Euro-Dollar currency pair.
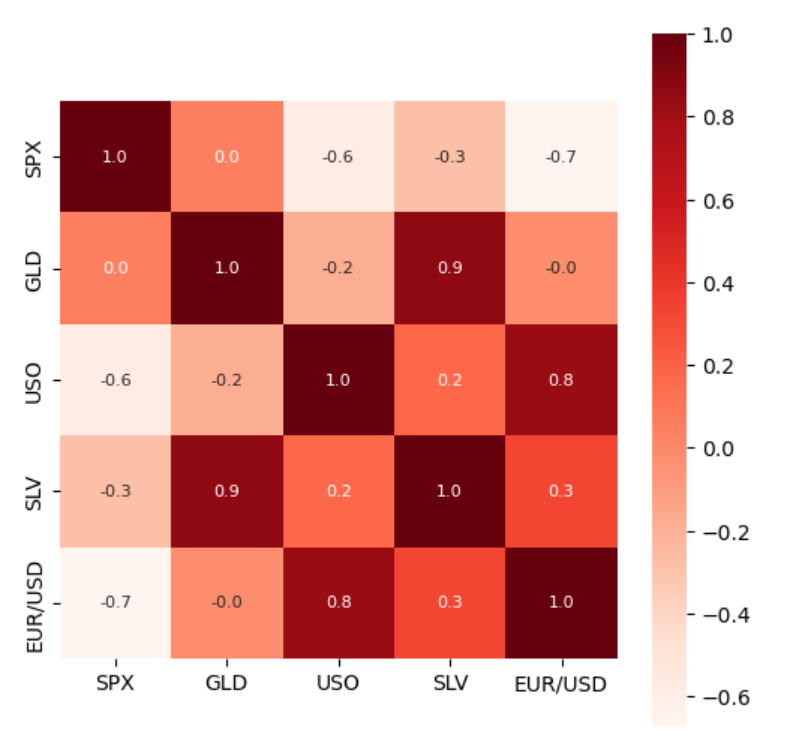
Correlation
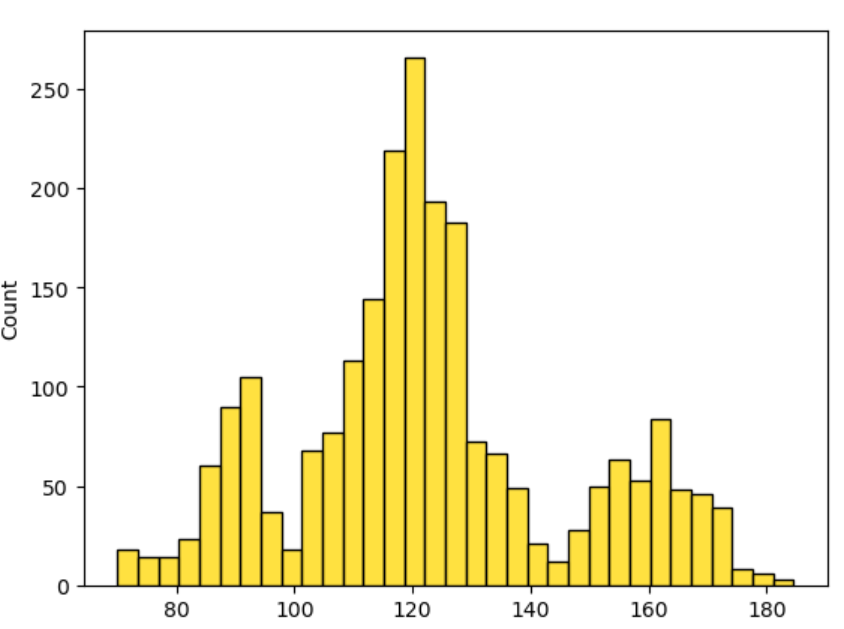
Prices of Gold
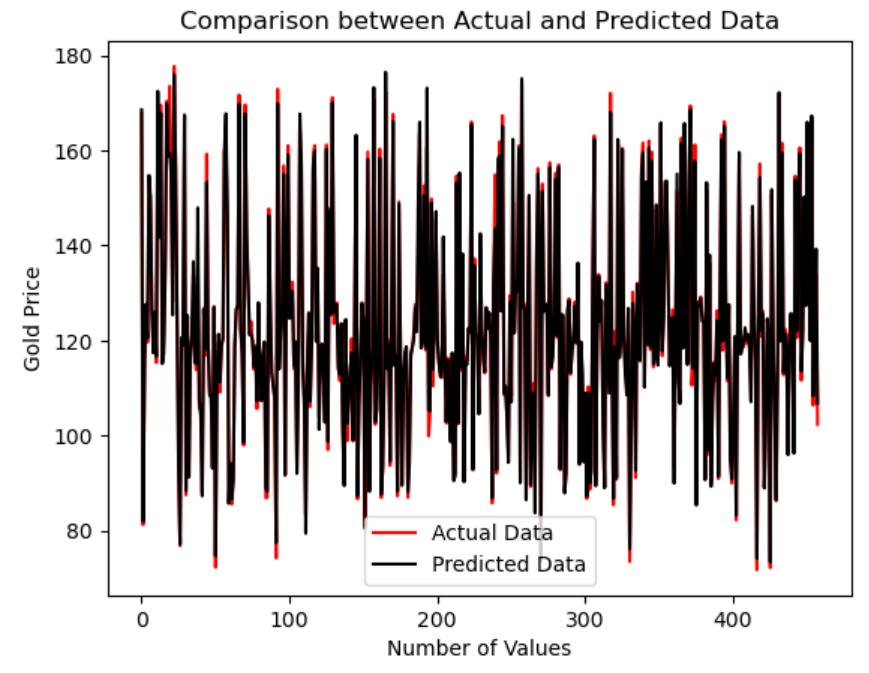
Error Visualization
Suraksha - The Accident Detection App
Suraksha is a comprehensive mobile application designed to monitor the user's acceleration and speed actively. In the event of an accident detection, the app initiates a countdown timer, providing the user an opportunity to confirm their safety. However, if the user fails to deactivate the counter within the allotted time, Suraksha automatically sends an alert message to the registered family members. This message includes crucial details such as the user's location and a distress message indicating that the user is in trouble. Suraksha's primary objective is to enhance its users' safety and well-being by promptly notifying their designated contacts in critical situations.
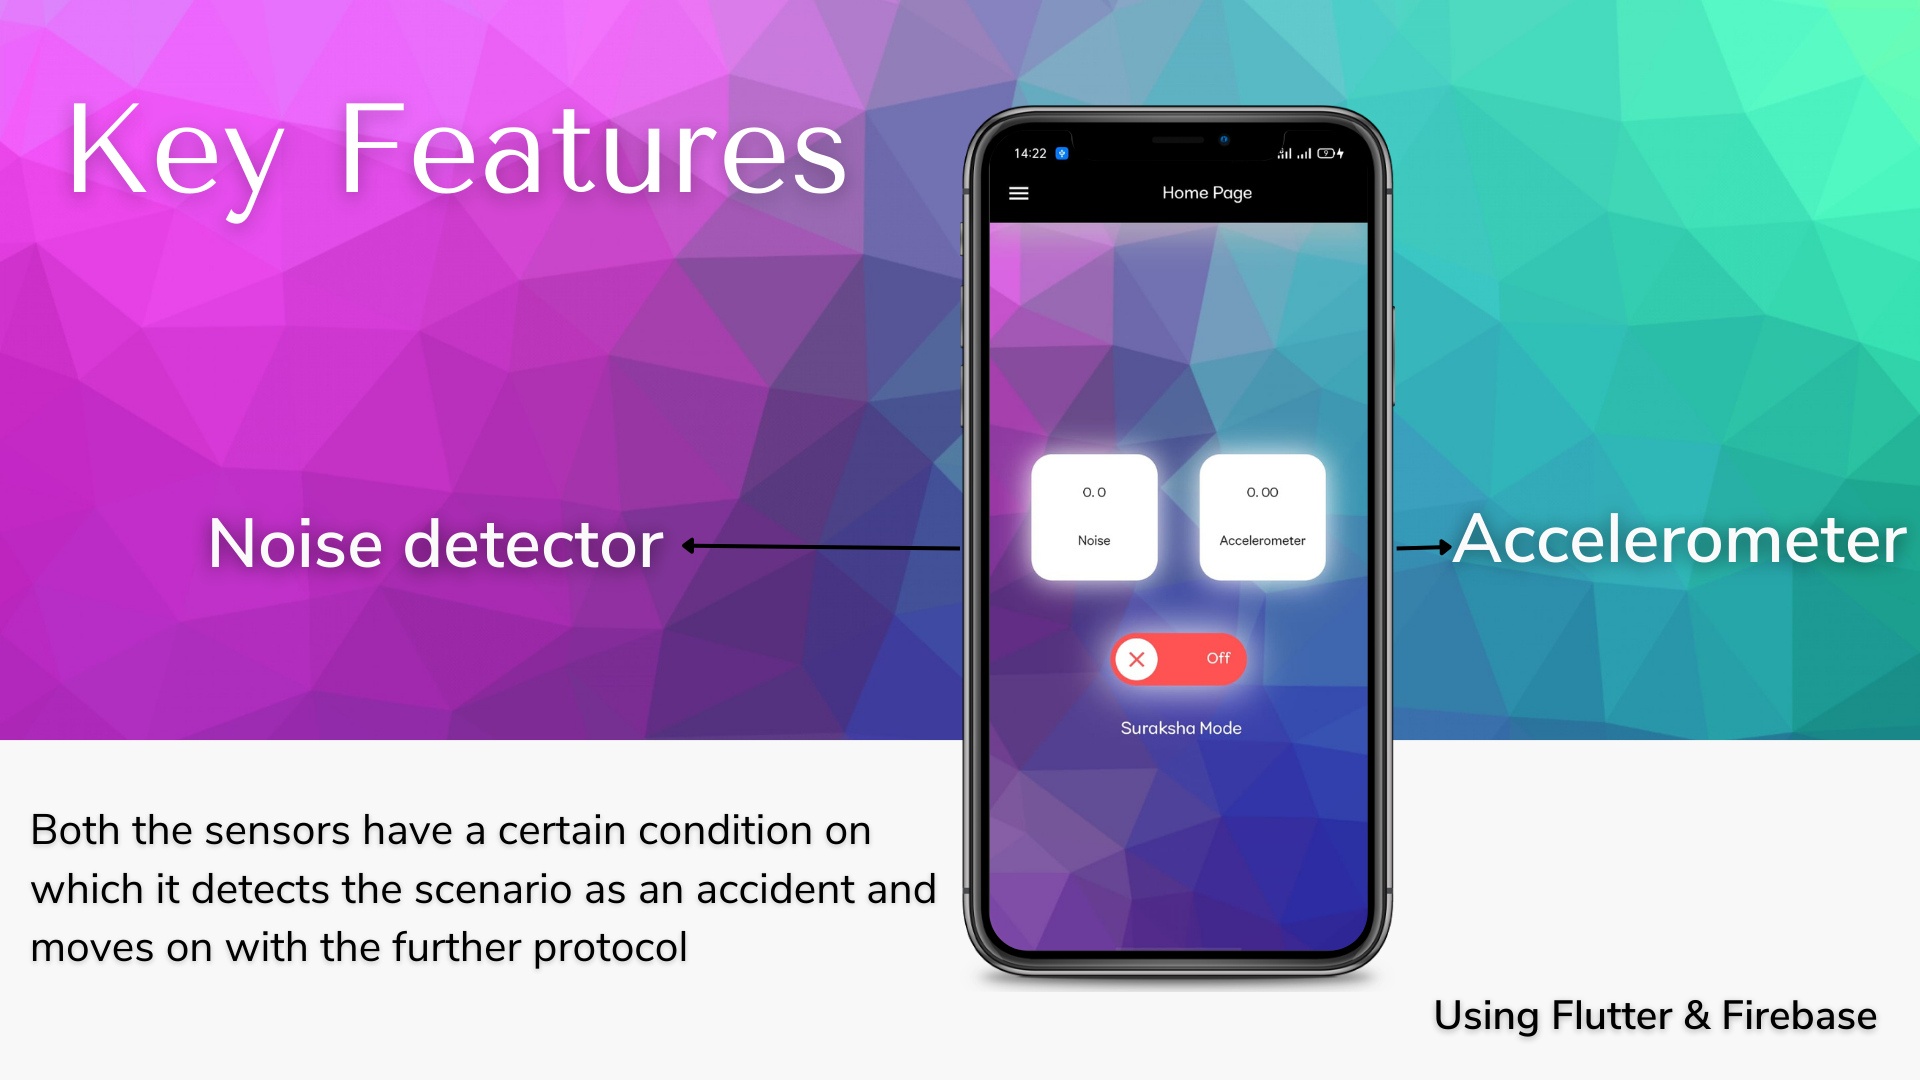
Main page and working
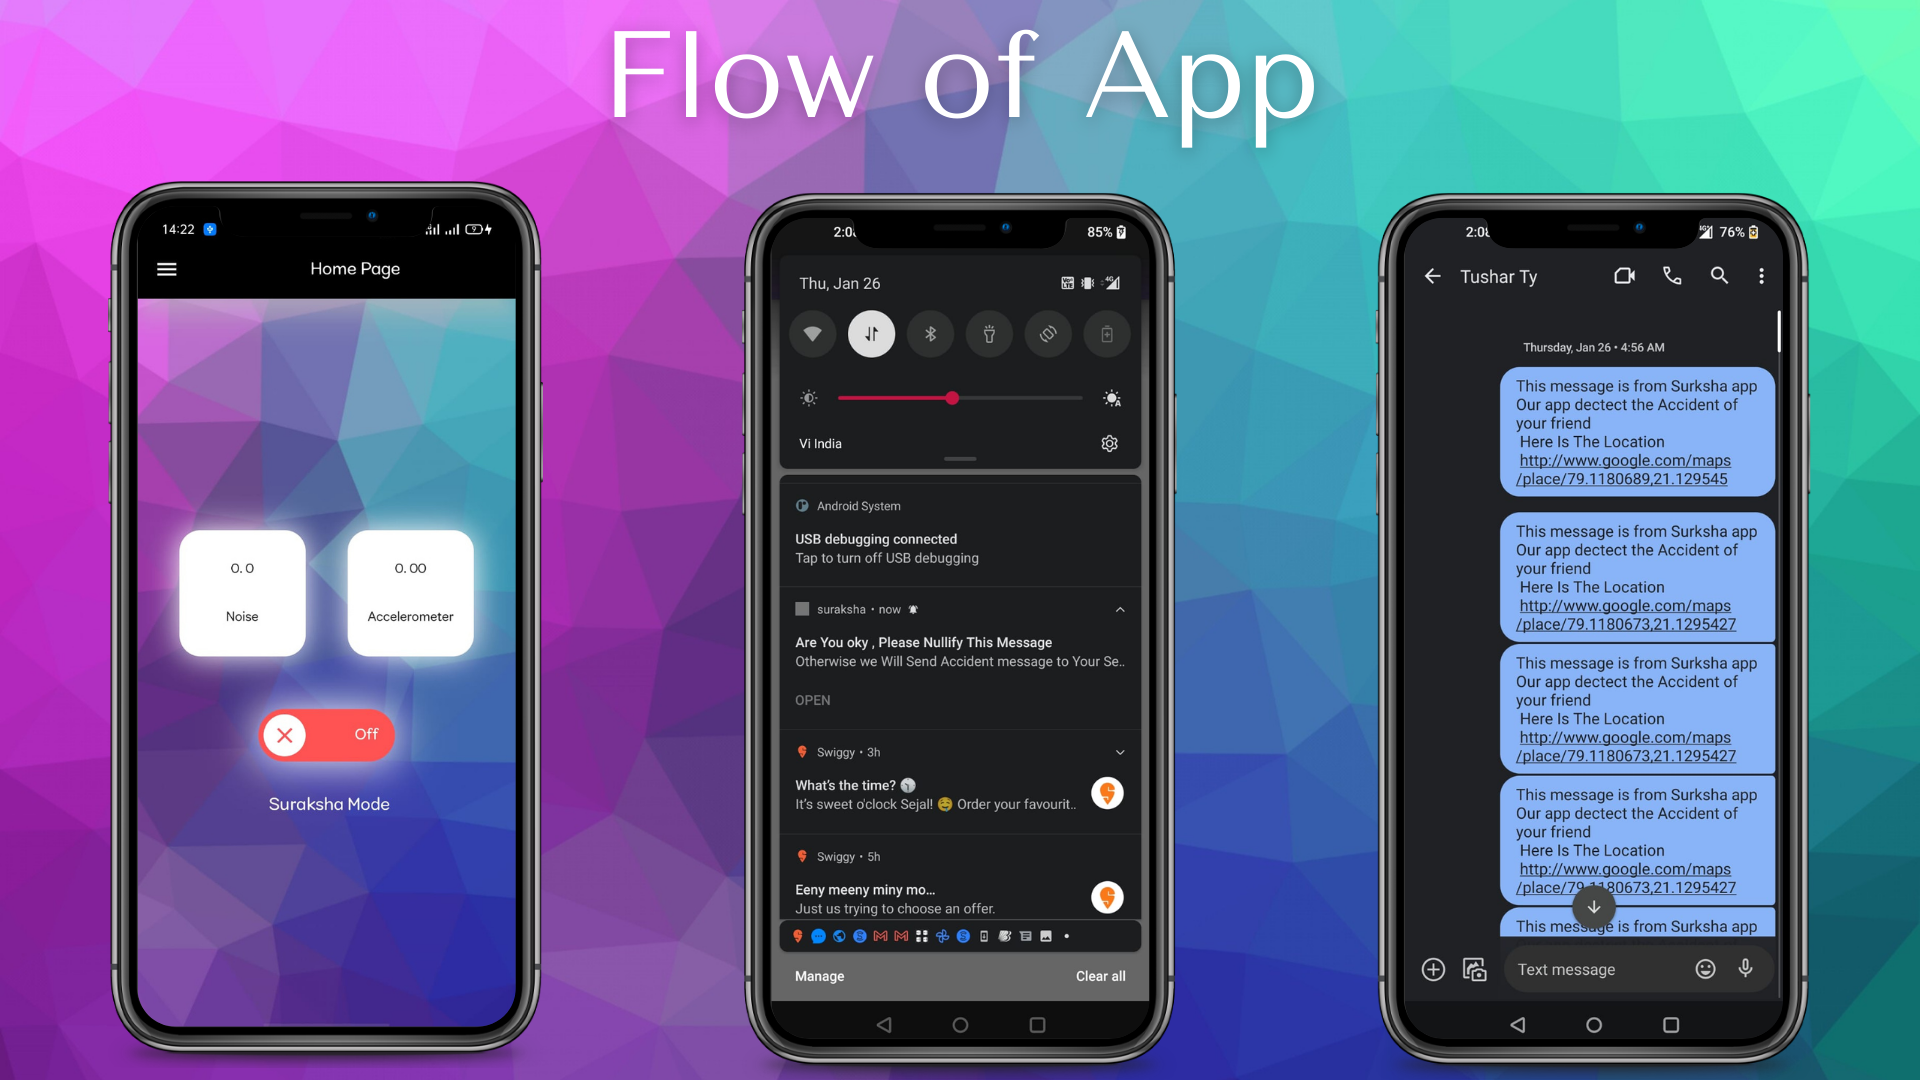
Different stages of the App
Our project had the opportunity to be showcased at the prestigious EPIC Start-Up Competition organized by Sardar Patel Institute of Technology in 2023. This competition attracted numerous participants from across the state, making it a highly competitive event. I am delighted to share that our project achieved significant recognition by securing the 3rd prize among the participating teams. This accomplishment reflects the dedication, ingenuity, and hard work invested by our team members, as well as the innovative nature and potential of our project. Winning this award at such a renowned competition serves as a testament to our project's excellence and demonstrates our ability to compete successfully at a high level.
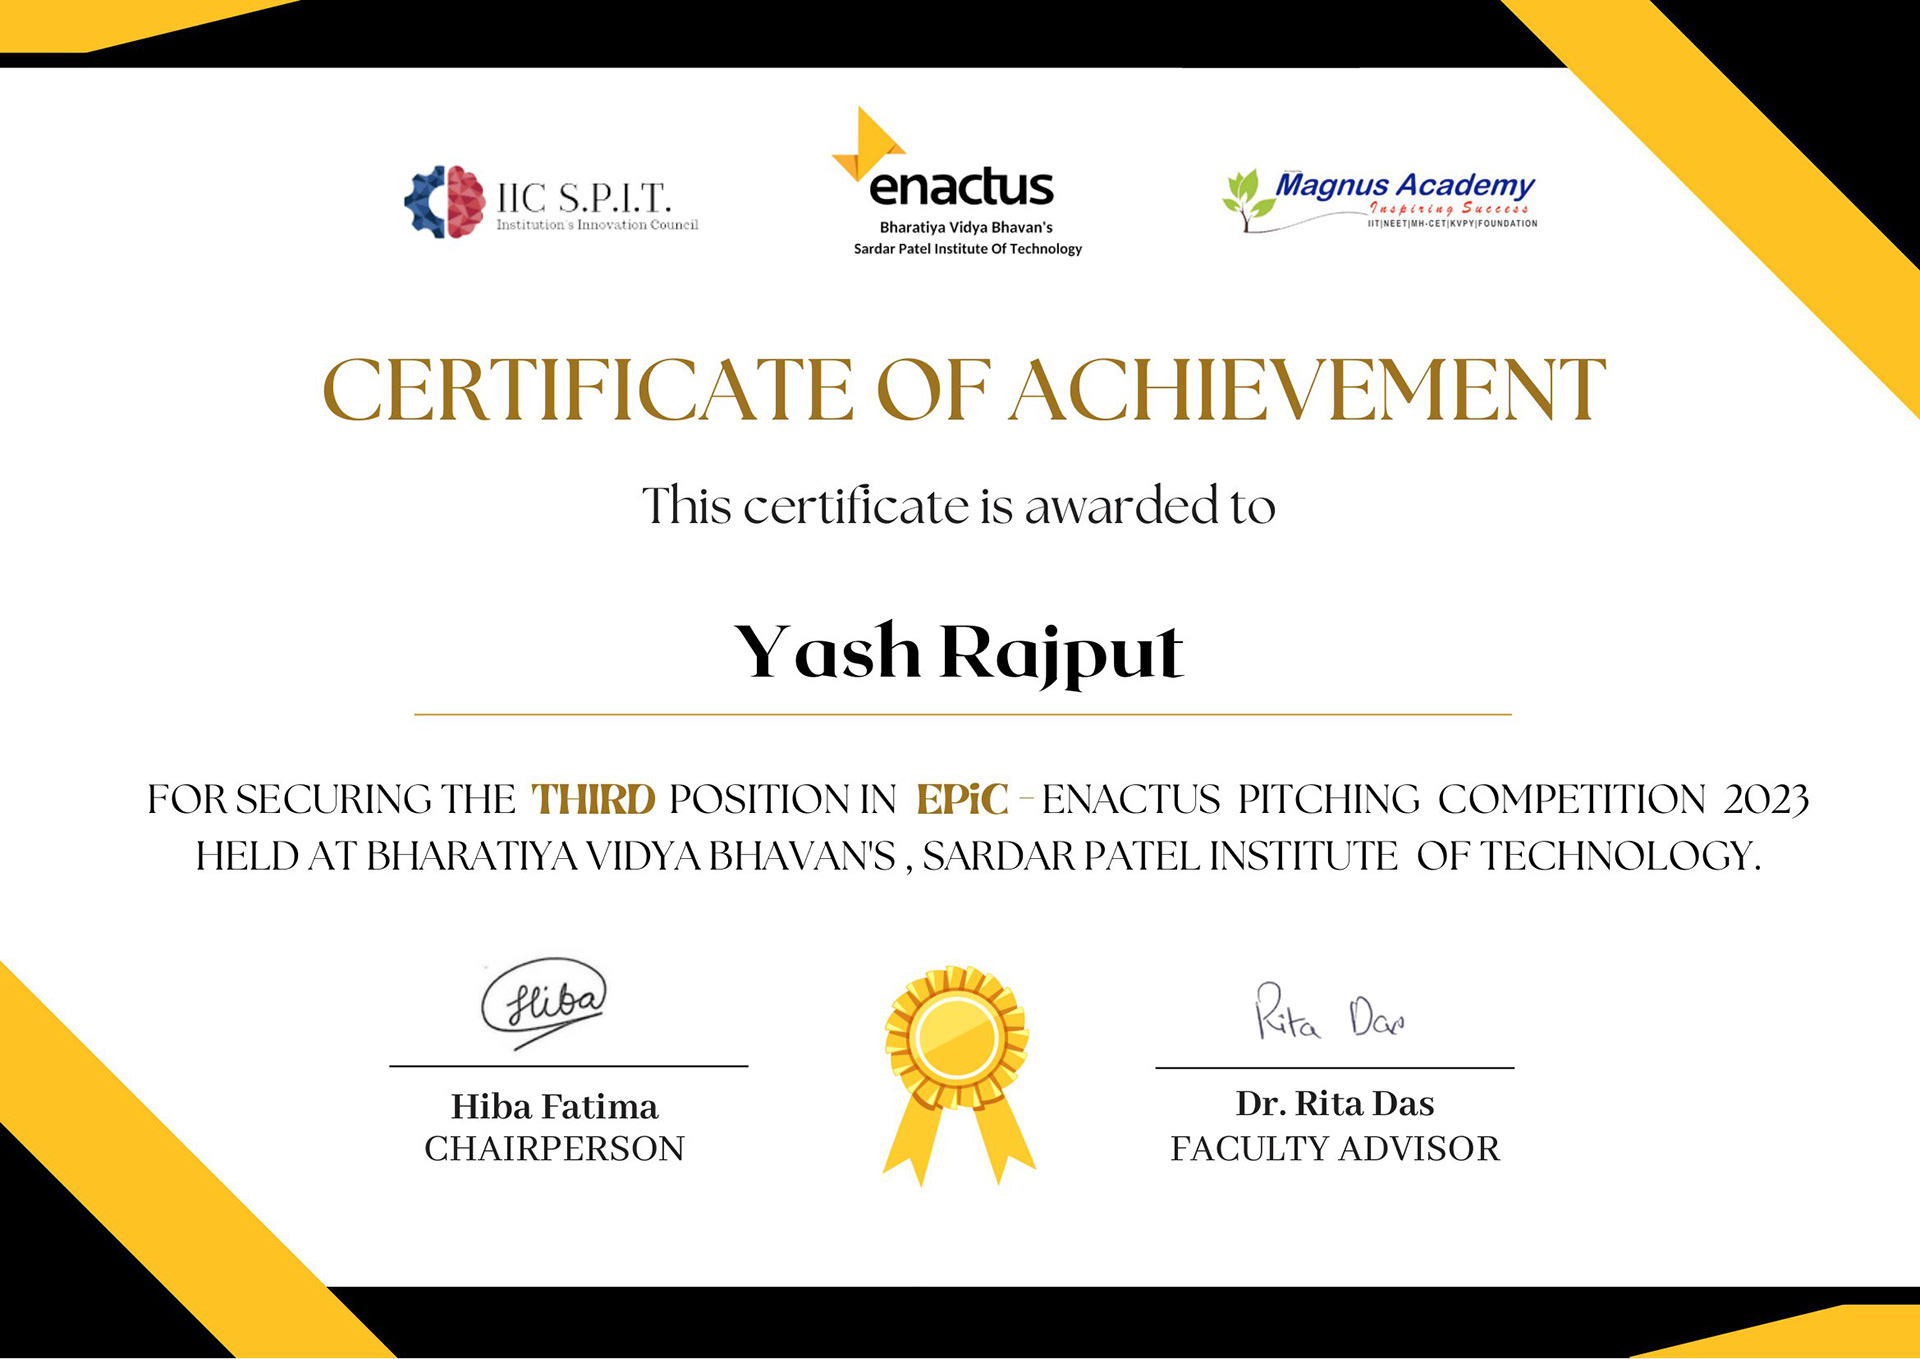
3rd Prize Certificate
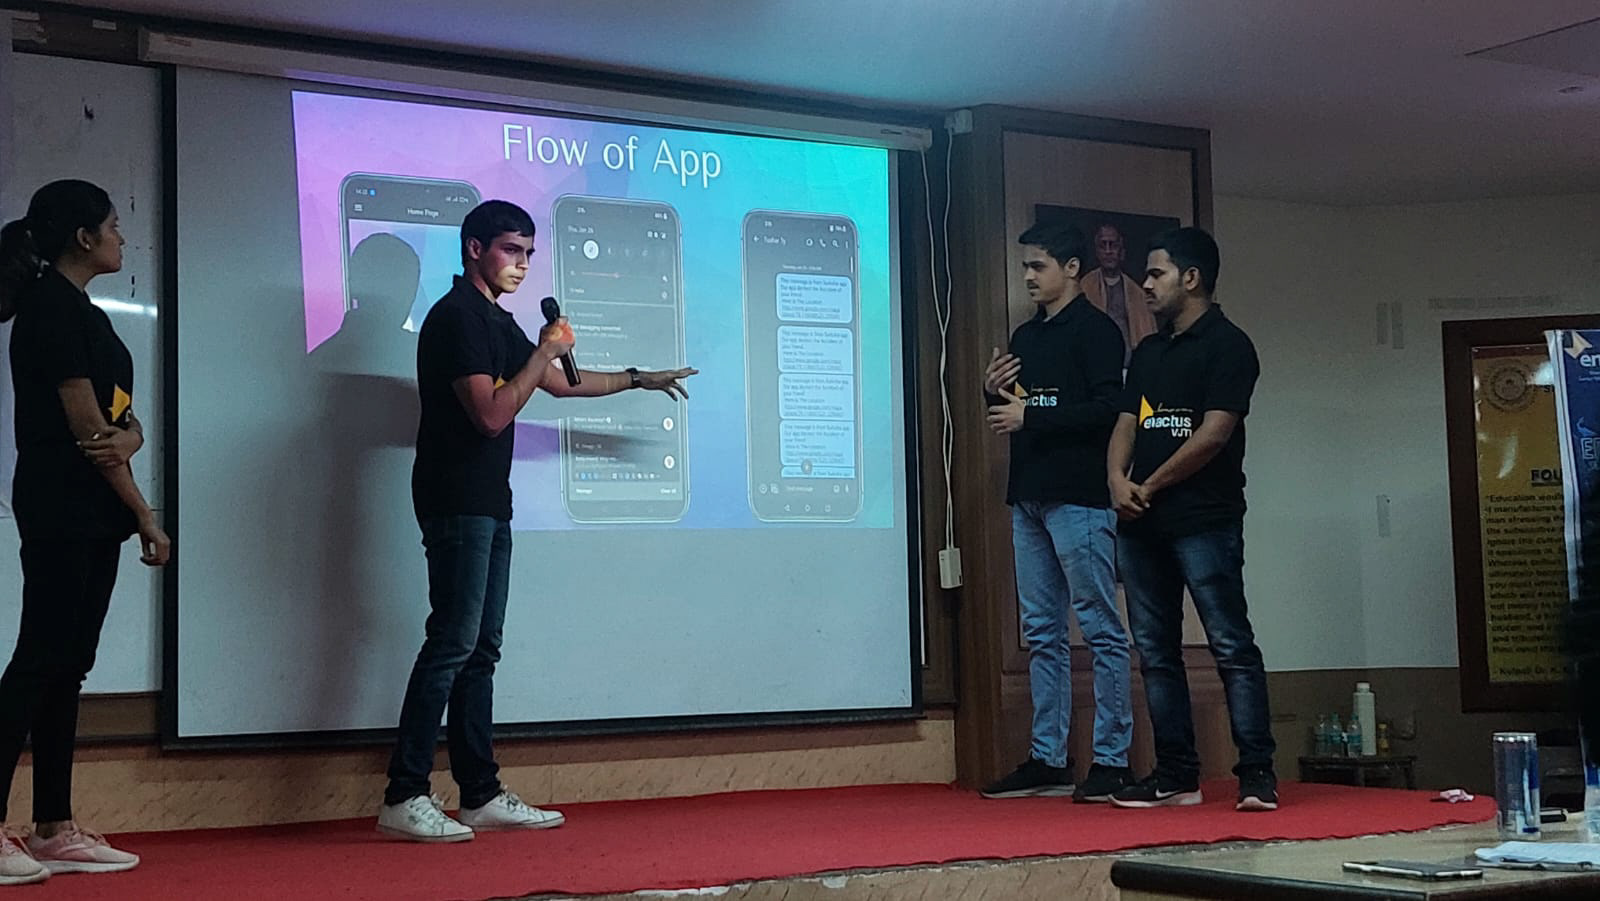
Presentation at Sardar Patel Institute of Technology
Race Car Design and Obstacle Avoidance
The initial phase of our project involved the creation of a CAD model using SolidWorks. This model was subsequently exported as a Unified Robotics Description Format (URDF) file, as it is required by the Robot Operating System (ROS). To simulate the URDF model, we utilized Gazebo along with a corresponding world file. For achieving turning, we implemented a Differential Drive System wherein the wheels are rotated in different directions. In order to detect obstacles, we incorporated Lidar sensors into the system.
Next, we conducted a comparative analysis of various algorithms such as the Potential Field Method, Follow the Gap Method, and Advanced Fuzzy Potential Field Method, among others. After a thorough evaluation, we ultimately selected the Obstacle Dependent Gaussian Potential Field method as the most suitable approach for our project. Subsequently, we proceeded with the implementation of the line following using the Partial Derivative Integral Method.
These sequential steps formed the foundation of our project, encompassing CAD modeling, simulation, obstacle detection using Lidar sensors, algorithm selection, and line-following implementation.
Line Following using PID
Obstacle Avoidance using ODGPF
Presentation
Cricket Analysis - Dashboard
The project involved creating the best 11 teams for the T20 World Cup 2022 based on specific parameters, such as scoring a minimum of 180 runs and defending at least 150 runs. To accomplish this, the following steps were taken:
1. Data Extraction: The project utilised Power Automate to extract data from the ESPN website. The relevant data were extracted and saved in CSV format for further analysis.
2. Data Preparation: The extracted data was then processed and prepared according to the detailed parameters set for the team. This step involved filtering and organising the data in Excel to ensure it aligned with the scoring and defending requirements.
3. Dashboard Creation: A dashboard was developed to provide a clear visualisation of the prepared data. The dashboard allowed for better analysis and helped in making informed decisions to determine the final 11 teams.
By following this approach, the project aimed to leverage data extraction techniques, data preparation in Excel, and visualisation through a dashboard to select the best 11 teams for the T20 World Cup 2022, adhering to the specific parameters set for scoring and defending.
Rough Design For Dashboard
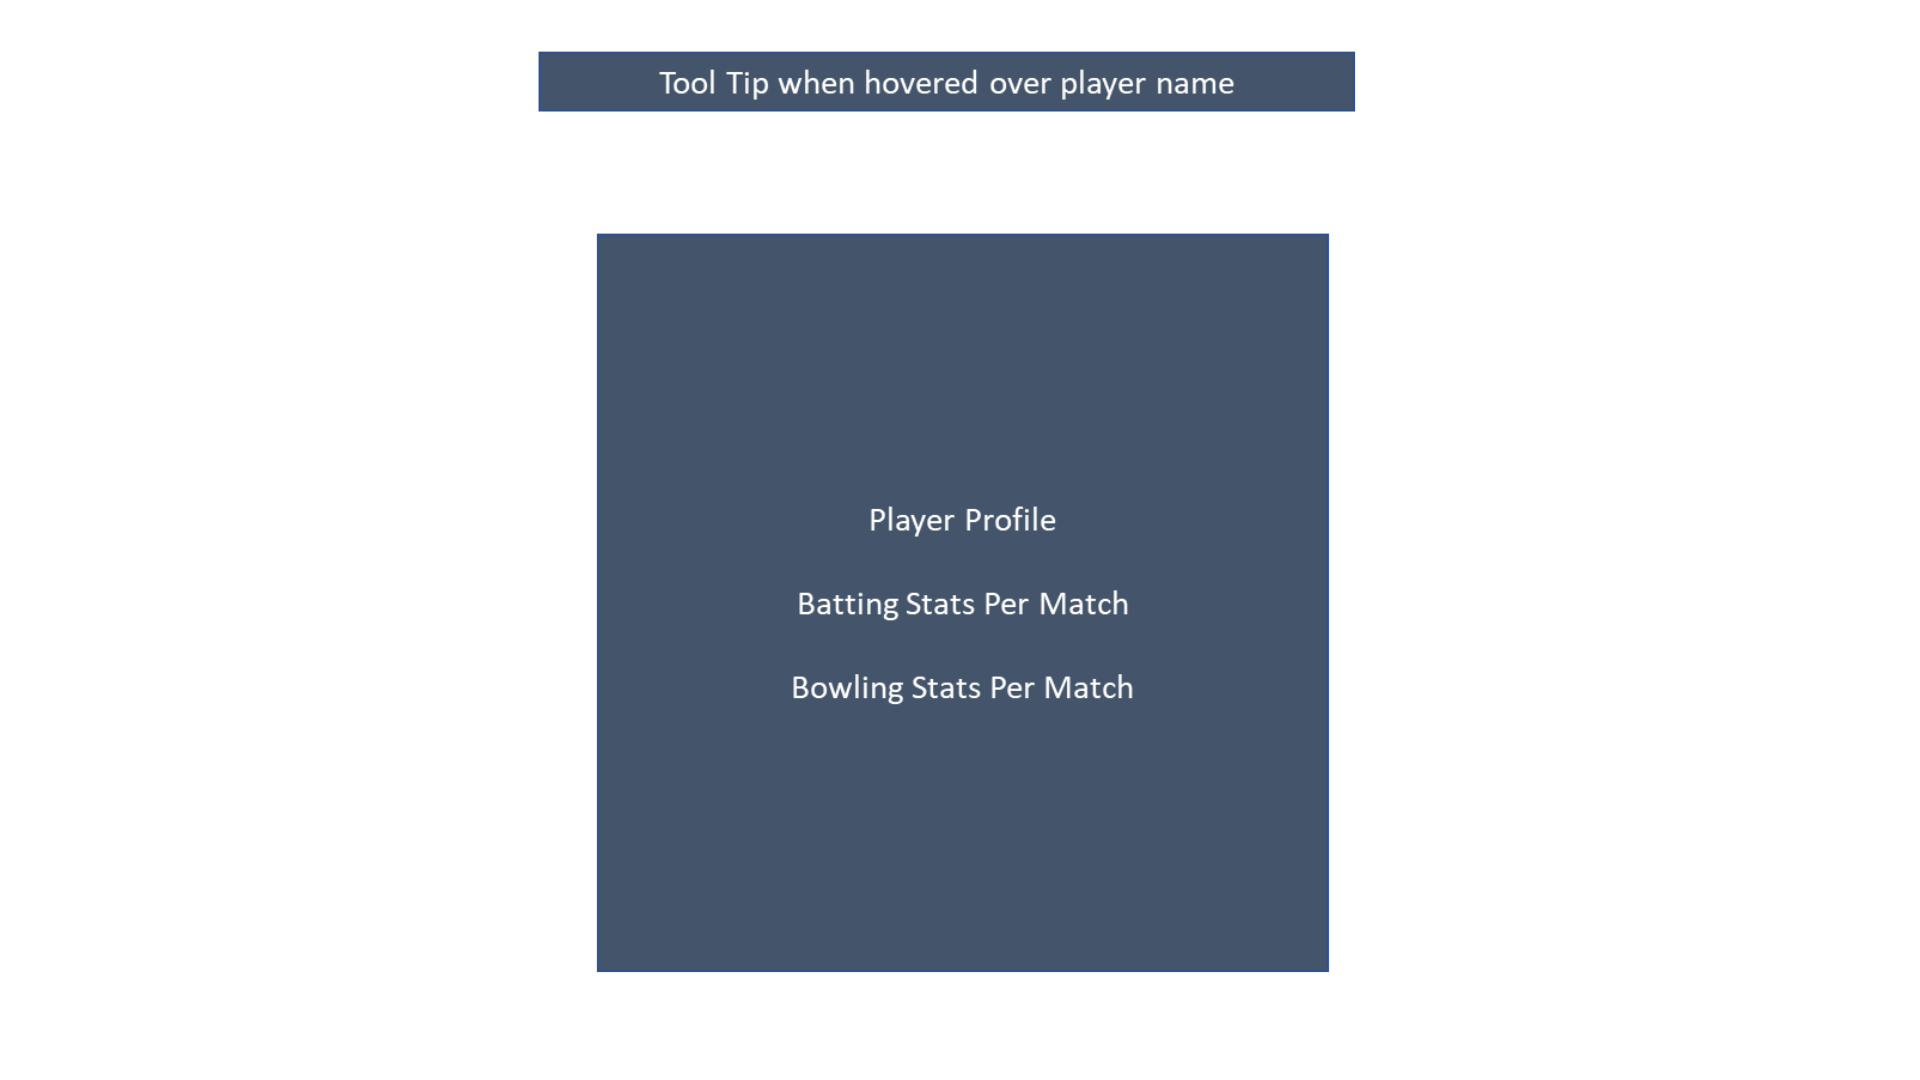
Individual Player
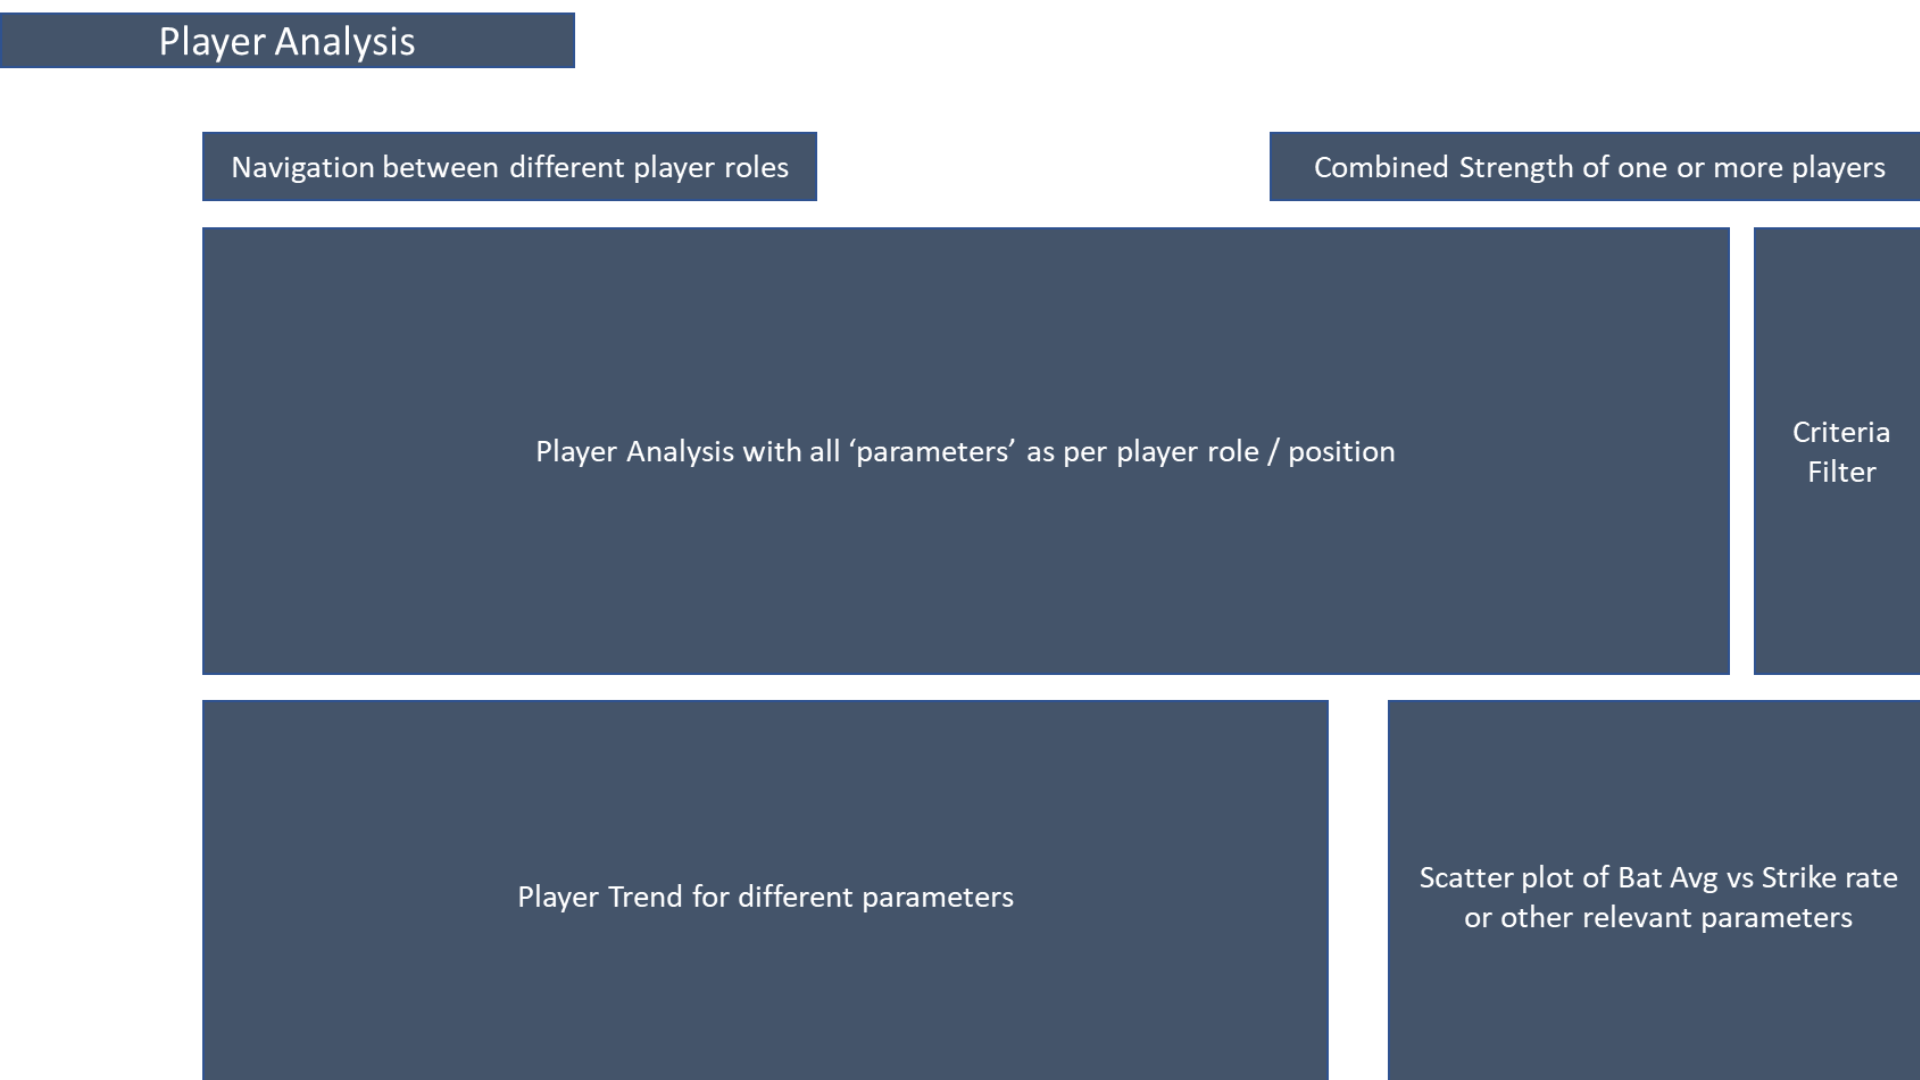
Player Analysis
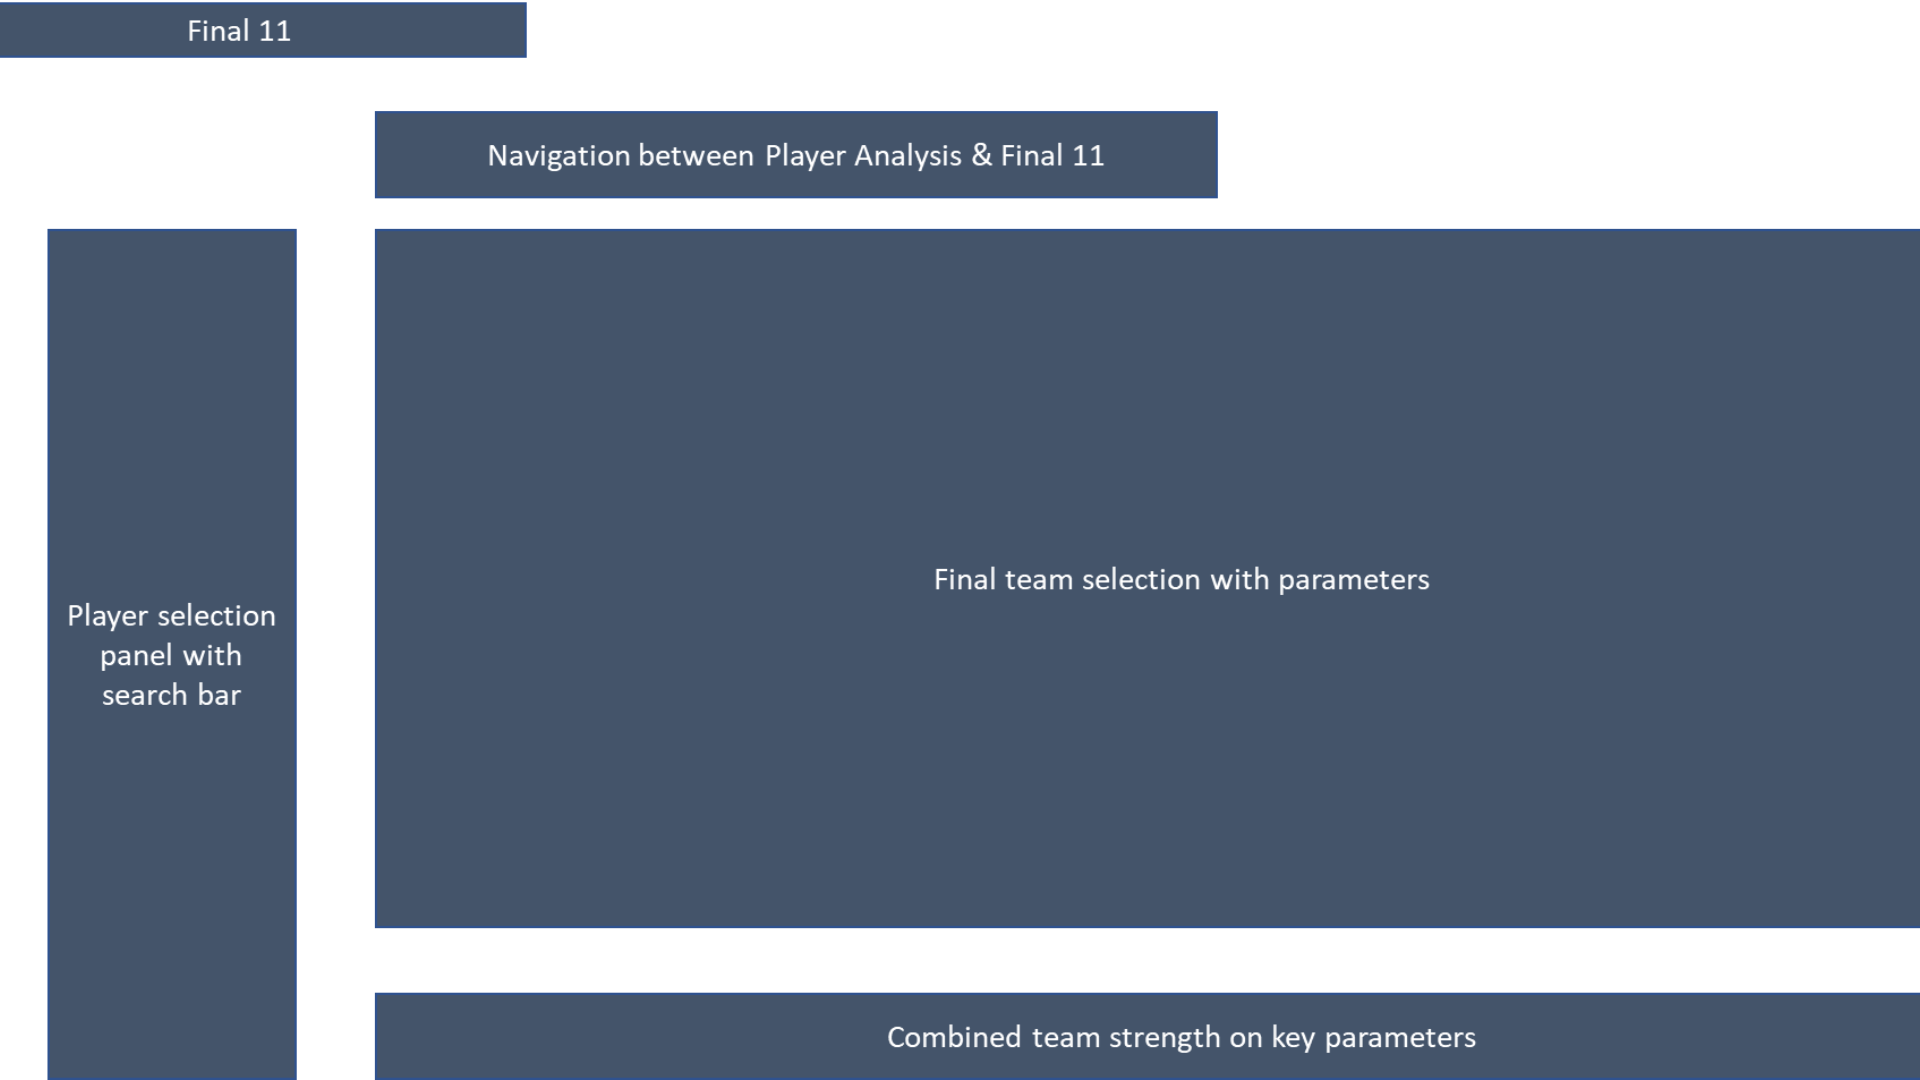
Final 11
Final Dashboard
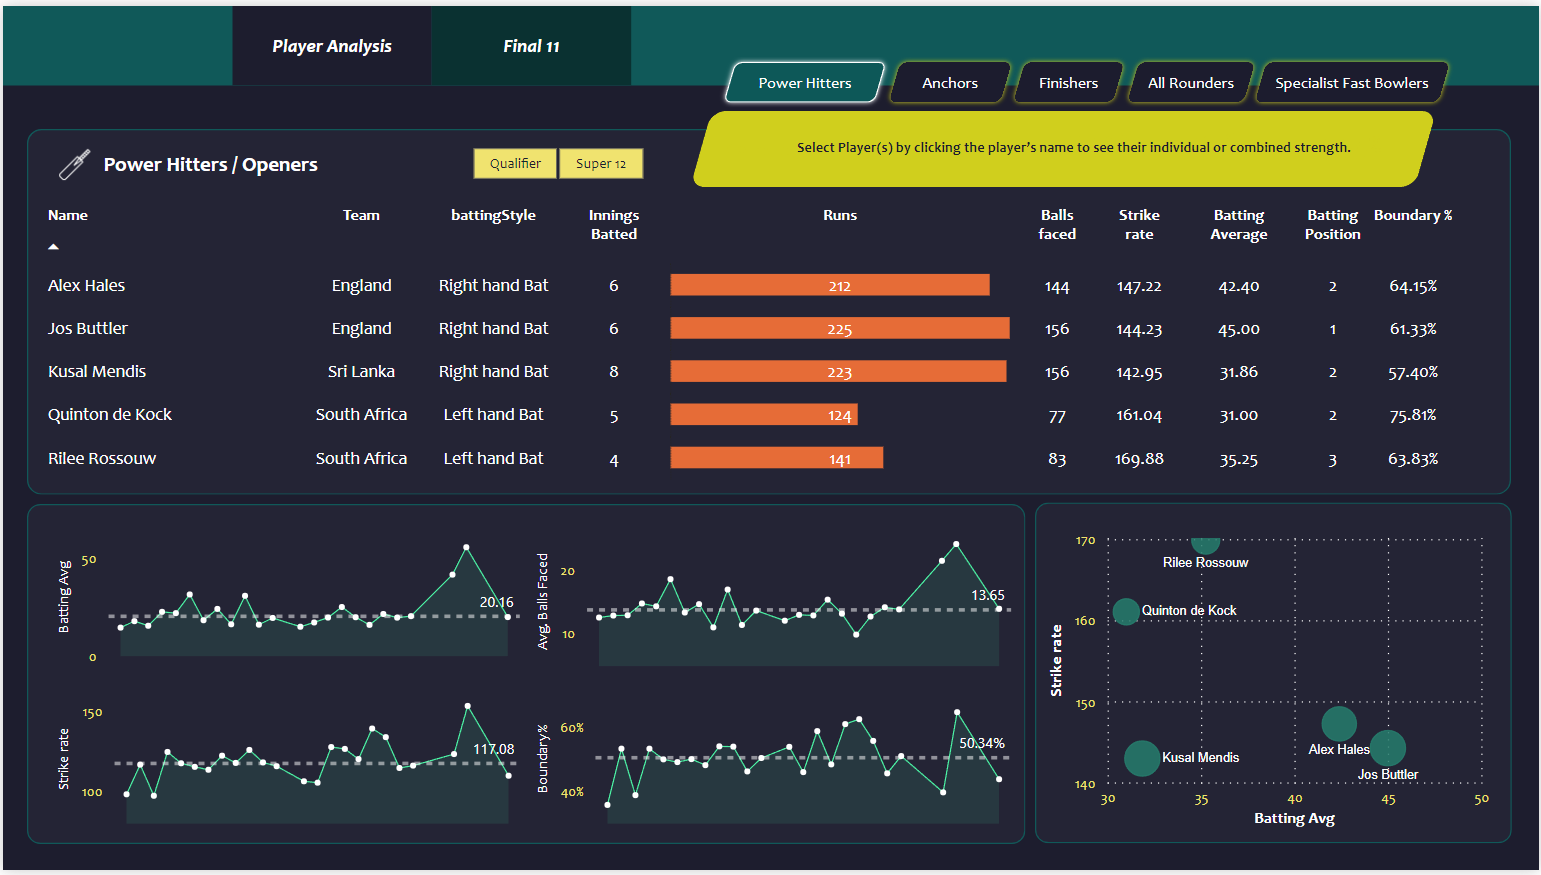
Dashboard for Openers
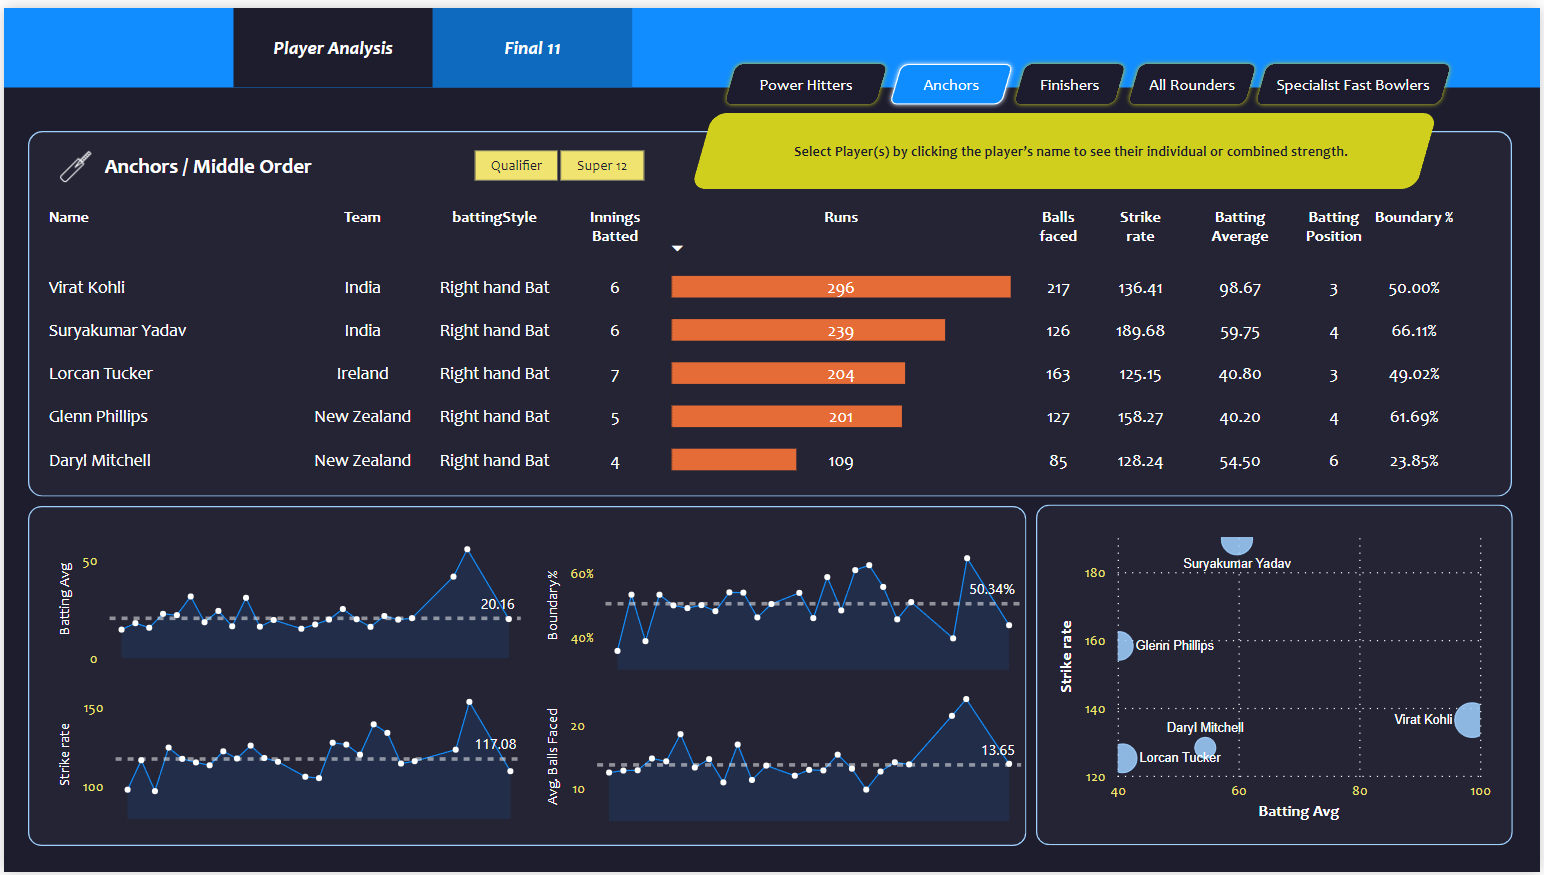
Dashboard for Middle Order
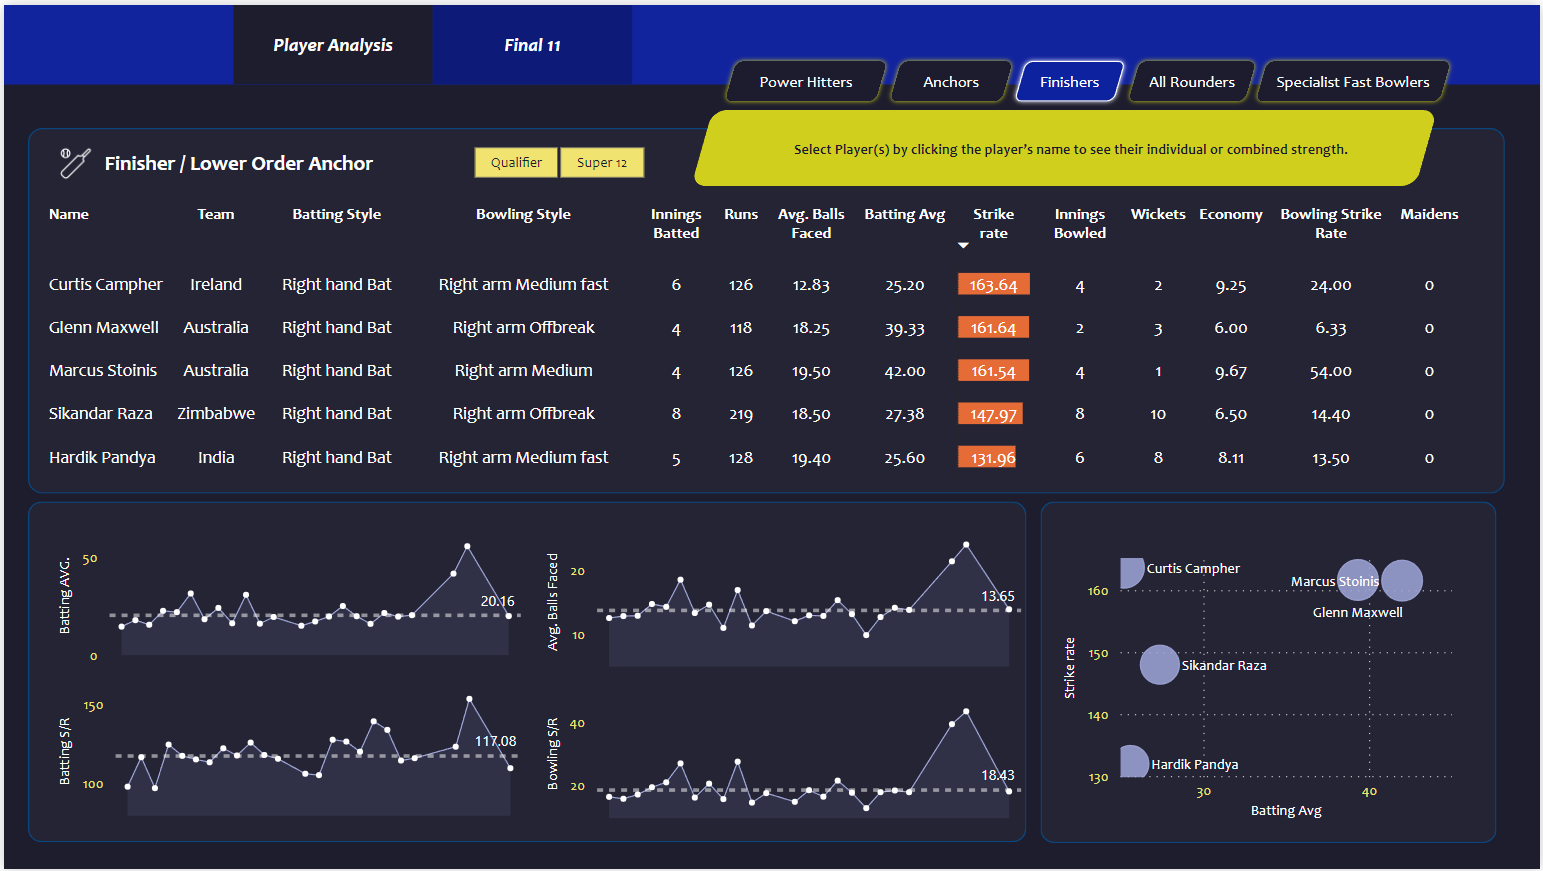
Dashboard for Finishers
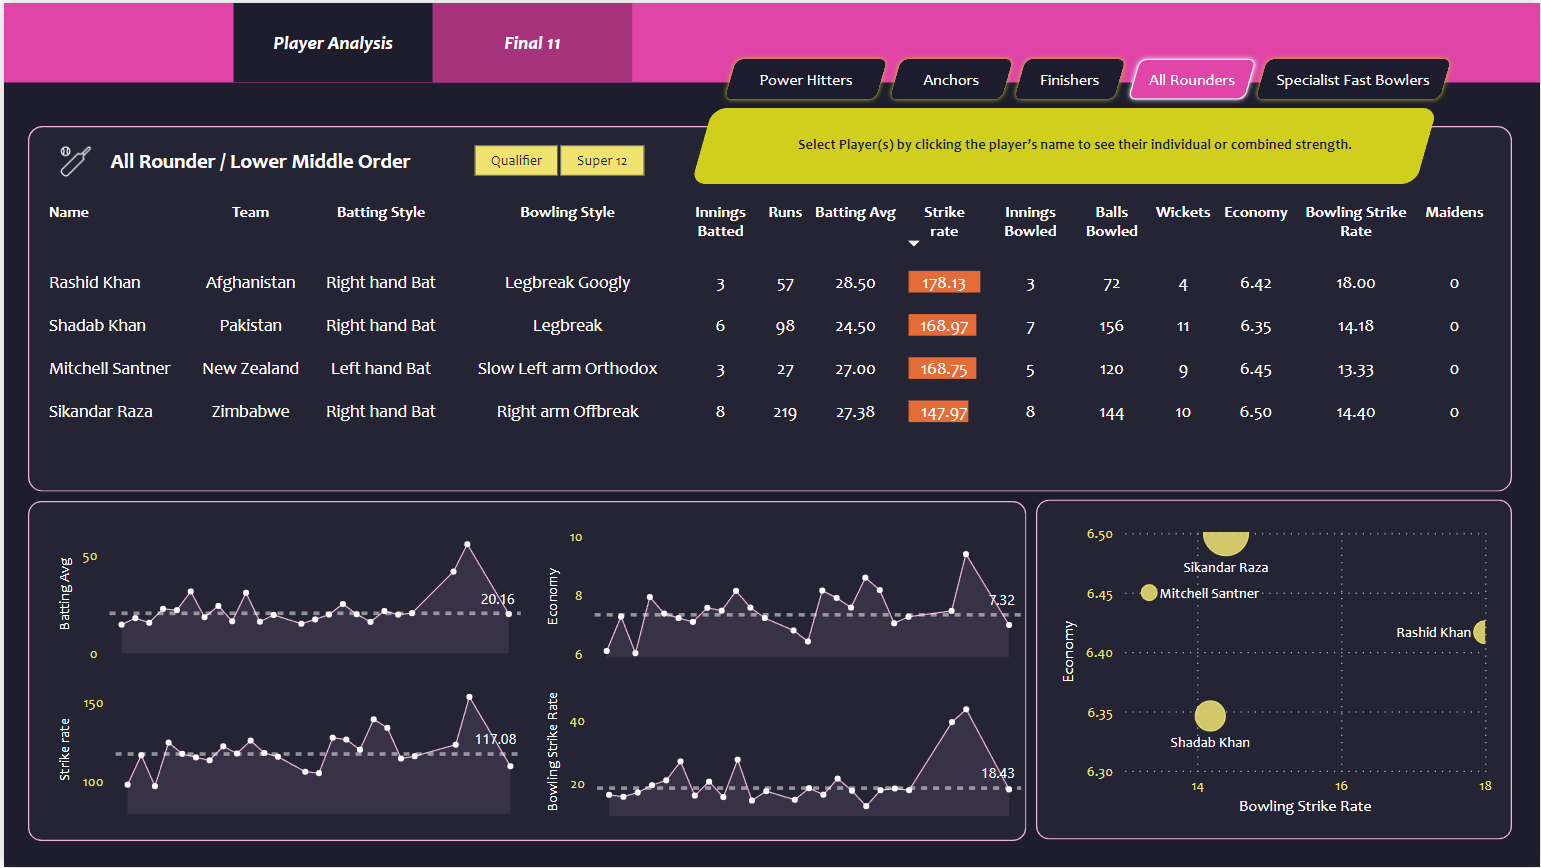
Dashboard for All Rounders
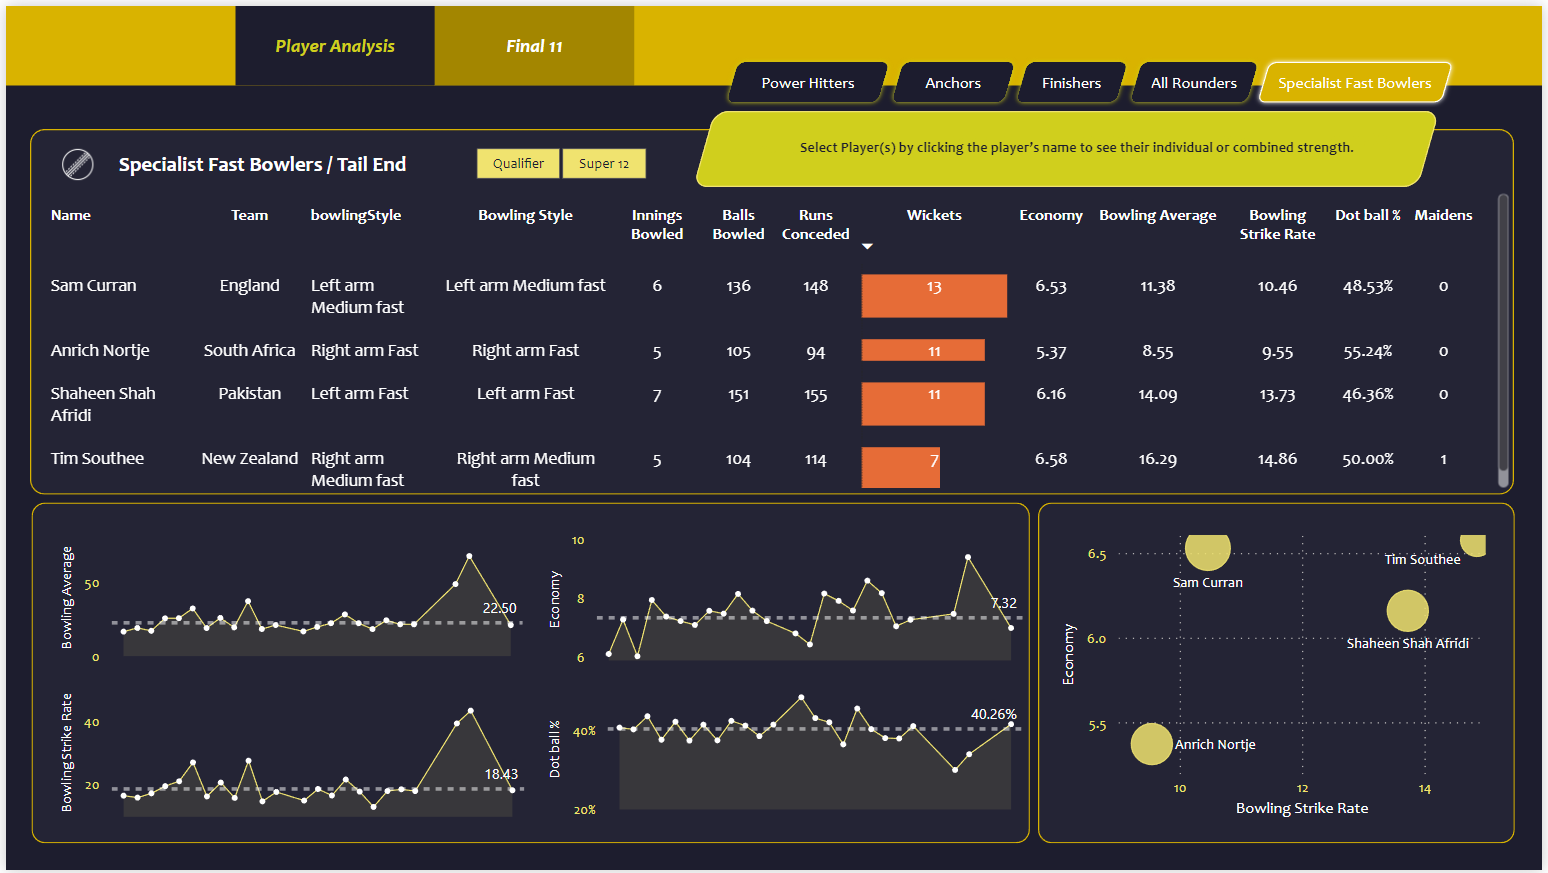
Dashboard for Fast bowlers
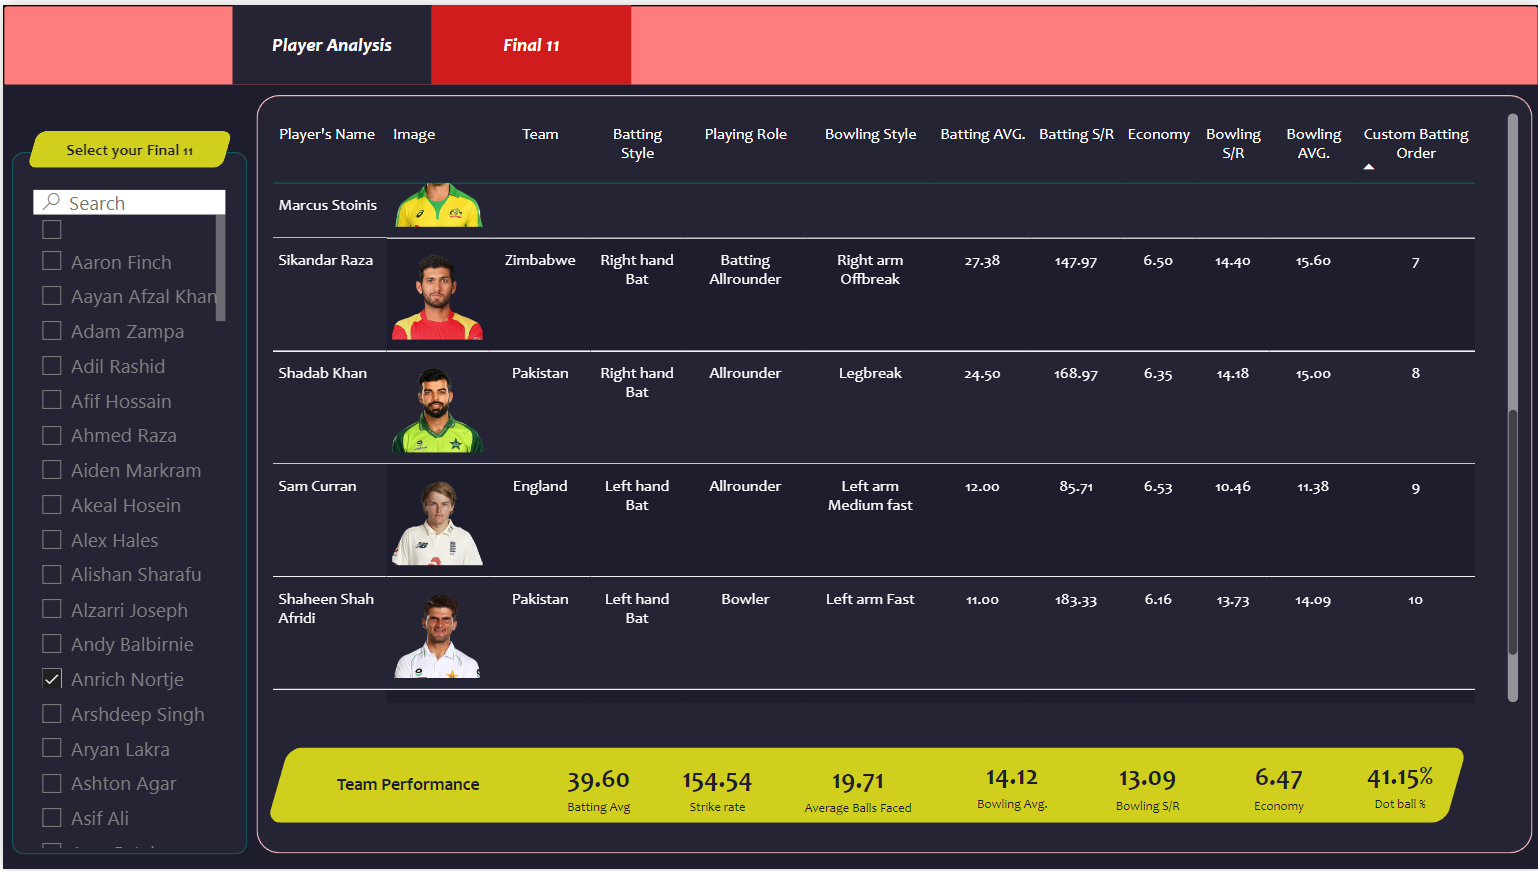
Final 11
Sales Analysis Dashboard
Presentation
My Project Reports For Trainity
My Other Case Studies, Reports, and Articles
If you would like to access any of the projects mentioned earlier, please send me an email requesting the specific project you're interested in or you can simply check out my Github Account


